ALEXANDER: You said today that you had the biggest electoral margin since Ronald Reagan, 304, 306 electoral votes. But President Obama had 365….
TRUMP: Well, I’m talking about Republicans.
ALEXANDER: George H.W. Bush, 426 when he won as president. So why should Americans trust you?
TRUMP: Well no, I was given that information. I don’t know, I was just given—we had a very, very big margin.
ALEXANDER: I guess my question is why Americans should trust you when you use information…
TRUMP: Well, I don’t know, I was given that information. I was given—I actually, I’ve seen that information around.
Lemkin: See how fucking effective one simple fact deployed in the moment can be? The man has a stable of four or five lies he constantly goes back to. Go and do likewise. You don’t, I got no sympathy for you.
Tag: facts
Lead, Lead?
Kevin Drum lays out a convincing case that the now-receding crime boom was primarily caused by leaded gasoline (in fact, the pattern repeats itself in country after country: as lead goes out of use in gasoline, crime goes down). Intriguingly, none of the major interest groups seem to care:
Political conservatives want to blame the social upheaval of the ‘60s for the rise in crime that followed. Police unions have reasons for crediting its decline to an increase in the number of cops. Prison guards like the idea that increased incarceration is the answer. Drug warriors want the story to be about drug policy. If the actual answer turns out to be lead poisoning, they all lose a big pillar of support for their pet issue.
Read the whole thing
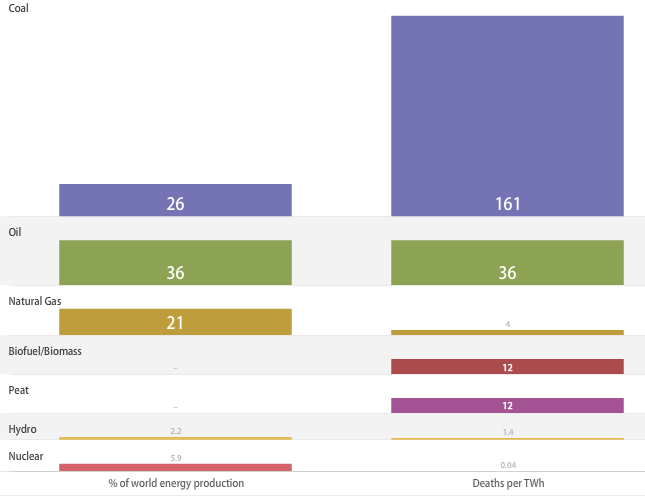
Coal kills many, many more people per TWh (tera-watt hour) of global production than any other source. Also worth noting that coal ash, seemingly released by the zettaton and then left in place wherever it may land in TN, is far more radioactive than nuclear waste.
Last year, American oil production reached its highest level since 2003. Let me repeat that. Our oil production reached its highest level in seven years. Oil production from federal waters in the Gulf of Mexico reached an all-time high. For the first time in more than a decade, imports accounted for less than half of what we consumed. So any notion that my administration has shut down oil production might make for a good political sound bite, but it doesn’t match up with reality.
Barack Obama, apparently forgetting that the facts do not matter. Without a coordinated messaging system to repeat this all day every day for 10 years it won’t even make a dent.
But, since we’re pretending facts are things that can be reported on, let’s add: “drill baby drill” won’t and can’t work. There isn’t enough oil in all of ANWR to make a dent in global demand, even if removed today by magic and all at once. As it stands, the best estimates of full production there would be between 0.4 and 1.2 percent of total world oil consumption in 2030. Read: not enough to matter, ever, under any imaginable circumstances on the global market as we know it. But why let that kind of crap thinking get in the way of national energy “policy?”
Every drop of oil in US territory that is thought of as technically recoverable (read: the over optimistic blue sky estimate) amounts to about 134 billion barrels; surely Sarah and the rest of the hockey Moms out there can get most of that extracted for us by tomorrow and all will be well with the world and gas will never rise above $1 a gallon again!
Oh, by they by, we used 20,680,000 bbl a day in 2007. Why, that means there’s US black gold enough to last us clear through 2014 if we really watch it and know-how our way to new and exciting technologies.
But: yawn. Charlie Sheen, everyone!
Re: Several of The Big Lies
Sorry, you are free to believe what you like, but this graph proves none of that, because it only goes back to Jan. 2010. It ignores the first 11 months of Obama’s adminstration, and seasonal changes in employment from quarter to quarter, year over year. It simply is not possible to examine just the most recent 11 months of data and draw any kind of big picture conclusions about the economy.
People choose cutoff points in graphs for a reason, to amplify the message they are trying to send. Let’s see some graphs that go back to 2007, or even earlier, for some context, and then we can debate facts about the economy.
So that takes care of (A) and (B).
Or, not. Does this graph go back far enough for you? Total non-farm jobs under Bush and Obama:

Same conclusion: The United States under Obama is creating jobs. Period. Fewer than desirable, but job creation nonetheless.
You continue:
As for ©, of course government-funded jobs are not real jobs, because we have to fund them. This distinction causes confusion among those who don’t understand the difference between “real” jobs and government, taxpayer-funded jobs.
A real job is created when a private citizen or business dips into its own assets, or takes out a loan, to hire a person.
This is unadulterated horse-shit. A job is a job. A person is hired to perform a task in exchange for money. Period. They are jobs every bit as real as any other. They transfer money, also just as real, directly into the broader economy. That money spurs a larger overall economy. More people are hired. Lather, rinse, repeat: the Federal Government gradually reduces support as the private markets recover and can employ more people. I’m not sure why this is remarkably hard to understand other than the fact that it demonstrably works (see original three-part graph) and yet is incompatible with a worldview that states that no action of government, large or small, can be for the betterment of society. Ever.
All that aside, though, it is indisputably true that federal/state/local government employment has been distinctly reduced under Obama. Perhaps this graph has a sufficient time scale to pass your ever-so-sensitive BS detector?

That’s government employment relative to population. While the government did indeed get a lot bigger under such noted socialists as DD Eisenhower, it has since shown no trend at all relative to population. There at the very end, under Obama, you’ll note both the census spike and a distinct downward slide.
But, feel free to believe whatever nonsense you are being peddled. These are just the rather inconvenient facts.
